Table of Contents
Rectangle with Supertrend Swing Trading Strategy: A price action swing trading method (with example) –
Hey Readers!!!
- Today, in less than 5 minutes we are going to discuss:
- How to anticipate breakouts?
- A price action breakout trading method with an example.
- A stock that has begun breaking out.

Predict breakouts using the rectangle pattern
Imagine you’re watching a race when one of the runners suddenly surges ahead of the pack, leaving everyone else behind. That is essentially what a breakout is in trading. It occurs when the price of a stock moves sharply in one direction, breaking out of its normal range.
The earlier you catch a breakout, the more money you’ll make.
And if you can determine a stock’s ‘normal range’, you’ll be able to spot its breakout early. A rectangle pattern can assist you identify the ‘normal range’.
A rectangle is a chart pattern generated when the price of a stock remains between an upper and lower limit. The price movement should result in at least two swing lows around a common level and two swing highs near similar levels.
A rectangular pattern, which represents consolidation and indecision, is sometimes known as a more sophisticated variant of a doji.

Let’s learn how to trade breakouts using the rectangle pattern ↓
Rectangle with Supertrend Swing Trading Strategy
The objective of this strategy is to:
- Use the Supertrend indicator to identify stocks in consolidation.
- Plot a rectangle around the consolidation and utilize it to catch a breakout at the appropriate time.
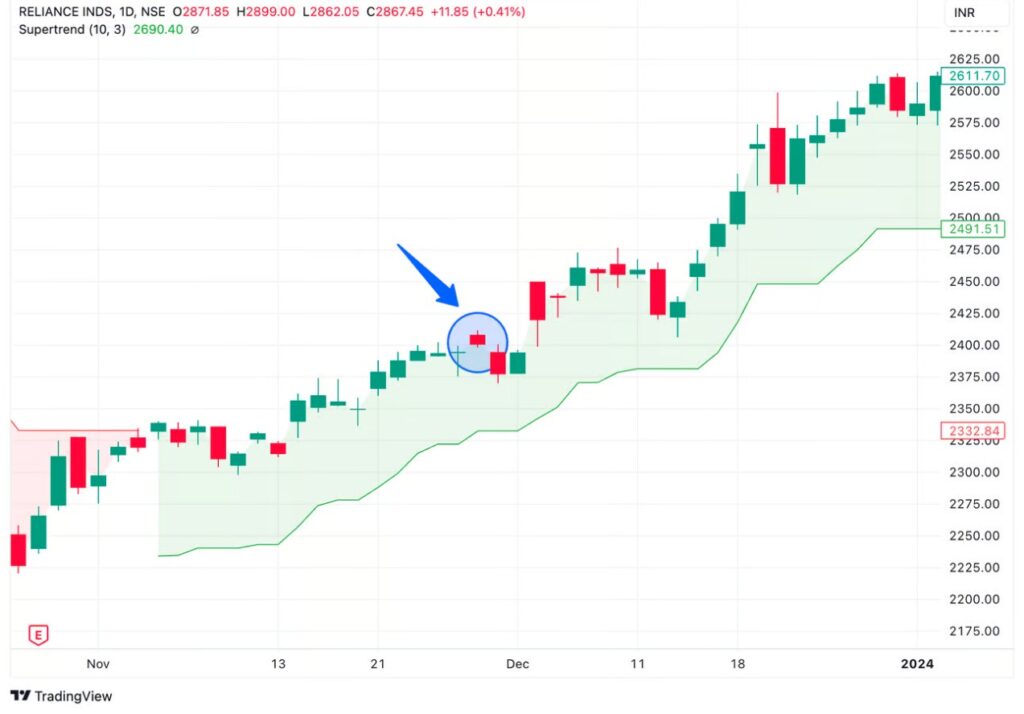
Historically, the Supertrend has been observed to be flat when markets consolidate or when volatility increases.
This method will be used on a daily timeframe basis, hence the name “swing trading strategy.”
| Entry / Long Trade 1) Scan for stocks where the Supertrend indicator has been flat for at least 10 trading sessions. The Supertrend line should be bullish (green). 2) Draw a rectangle around the range; a consolidation should be visible. 3) Wait for a bullish candle to appear and break the upper boundary of the rectangle. You can enter at that candle or wait for a retest to confirm the recently built support. | Exit / Short Trade 1)Scan for equities where the Supertrend indicator has been flat for at least 10 trading sessions. The Supertrend line should be bearish (red). 2) Draw a rectangle around the range; a consolidation should be visible. 3) Wait for a bearish candle to appear and violate the rectangle’s lower limit. You can either exit at the candle itself or wait for a retest to confirm the newly created resistance. |
Example – Long Trade in TATAINVEST
Below is TATAINVEST‘s daily chart. Observing the rectangles and the behavior of the Supertrend, one can see how TATAINVEST provided several trade opportunities utilizing this method.
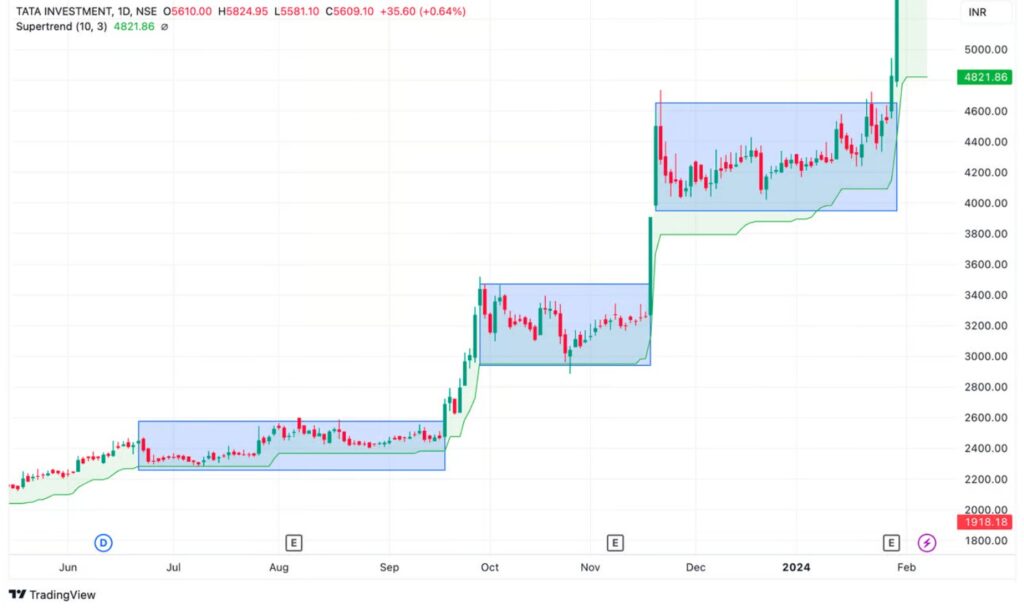
We searched for such stocks ourselves, where the price has been consolidating inside a rectangle range. Wouldn’t it be amazing if we could find stocks that, in addition to a rectangular consolidation, show a fresh breakout (as of February 7th, 2024)?
Continue reading to find out what we got!
This Stock Has Begun To Break Out! (Example)
Scanning over NSE500‘s ‘Supertrend flat’ stock charts, we discovered the following stock breaking out of an observable rectangle pattern with above-average volumes (as on February 7th, 2024):
GPIL (Daily Timeframe)
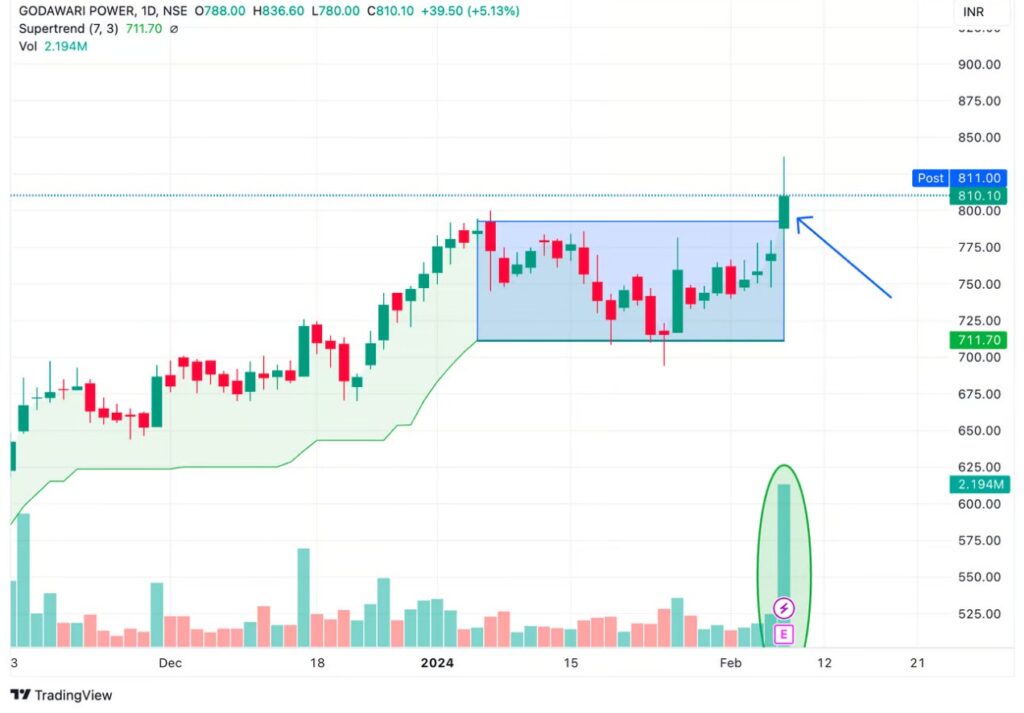
It should be noted that none of the stocks listed above are meant as recommendations. Prior to trading or investing, conduct your own due diligence.
You’ve probably observed that, despite the rectangle structure, the angulation of the Supertrend indicator itself serves as a good indicator of potential future movement.
Frequently Asked Questions (FAQs)
1. What is a breakout in trading?
A breakout in trading refers to a significant movement in the price of a financial asset, where it abruptly moves beyond a defined range or pattern, often accompanied by high trading volume. It signifies a shift in market sentiment and can present lucrative trading opportunities for investors.
2. How does a rectangle pattern help in identifying breakouts?
A rectangle pattern assists in identifying breakouts by delineating a trading range where the price of an asset consolidates between parallel support and resistance levels. Breakouts occur when the price breaches these levels, signaling potential future price movements and allowing traders to anticipate and capitalize on directional changes.
3. What is the Supertrend indicator?
The Supertrend indicator is a popular technical analysis tool used by traders to identify trend directions and potential entry and exit points in the market. It plots a trend-following line on price charts, with bullish (green) and bearish (red) signals indicating upward and downward trends, respectively.
4. How do you use the Supertrend indicator in swing trading?
In swing trading, the Supertrend indicator is utilized to identify stocks undergoing consolidation phases, where price movements are relatively stable. Traders look for instances where the Supertrend line remains flat for a certain period, indicating consolidation, and use this information to plot trading ranges and anticipate breakouts.
5. What are the entry criteria for long trades in the Rectangle with Supertrend Swing trading strategy?
For long trades in the Rectangle with Supertrend Swing Trading strategy, traders scan for stocks exhibiting flat Supertrend lines over a specified timeframe, accompanied by bullish (green) signals. They then draw rectangles around consolidation zones and wait for bullish candlesticks to breach the upper boundary, signaling entry opportunities.
6. How do you identify exit points for short trades in this strategy?
Exit points for short trades in the Rectangle with Supertrend Swing Trading strategy are identified by scanning for stocks with flat Supertrend lines and bearish (red) signals. Traders draw rectangles around consolidation zones and wait for bearish candlesticks to breach the lower boundary, indicating potential exits or profit-taking opportunities.
7. Can you explain the significance of consolidation in swing trading?
Consolidation in swing trading signifies periods of price stability and indecision in the market, where the price of an asset oscillates within a narrow range. It allows traders to identify potential breakout levels and plan their trading strategies accordingly, aiming to capitalize on subsequent price movements.
8. What role do candlesticks play in technical analysis?
Candlesticks play a crucial role in technical analysis by visually representing price movements over a specific period. Traders analyze candlestick patterns to gauge market sentiment, identify potential reversals or continuations, and make informed trading decisions based on the patterns formed.
9. How can one analyze market volatility?
Market volatility can be analyzed using various technical indicators and statistical measures such as standard deviation and average true range. Traders assess volatility levels to gauge the magnitude of price fluctuations, anticipate potential risks, and adjust their trading strategies accordingly to manage risk exposure.
10. What factors should be considered before trading based on this strategy?
Before trading based on the Rectangle with Supertrend Swing Trading strategy, traders should consider factors such as market conditions, trend strength, volume patterns, and potential catalysts affecting the underlying assets. Additionally, conducting thorough research, practicing risk management, and staying updated on market developments are essential for successful implementation of the strategy.
")


