Table of Contents
Introduction
Swing trading, a strategy capturing short to medium-term price movements, is a dynamic venture requiring astute decision-making. One crucial aspect influencing success is the selection and adept use of technical indicators. In this comprehensive guide, we explore the best technical indicators for successful swing trading, offering insights, strategies, and real-life examples.
Understanding Swing Trading
Before delving into technical indicators, it’s essential to grasp the fundamentals of swing trading. Unlike day trading, which involves rapid buying and selling within a single day, swing trading allows for a more relaxed timeframe, accommodating larger price movements.
Key Criteria for Best Technical Indicators
Relevance to Swing Trading
Not all technical indicators are suitable for swing trading. The selected indicators but probably the best technical indicators must align with the strategy’s time horizon, identifying trends and potential reversals within the desired timeframe.
Impact on Decision Making
Technical indicators should aid, not hinder, decision-making. Traders need indicators that provide clear signals and complement their overall analysis.
Types of Technical Indicators
Here are some best technical indicators that can help you in successful swing trading
Moving Averages
Simple Moving Averages (SMA)
SMA smoothens price data to create an average, revealing trends over a specified period. For swing traders, the crossover of short-term and long-term SMAs can signal potential entry or exit points.
Exponential Moving Averages (EMA)
EMA places more weight on recent price data, reacting faster to market changes. Swing traders often prefer EMA for its responsiveness to current trends.
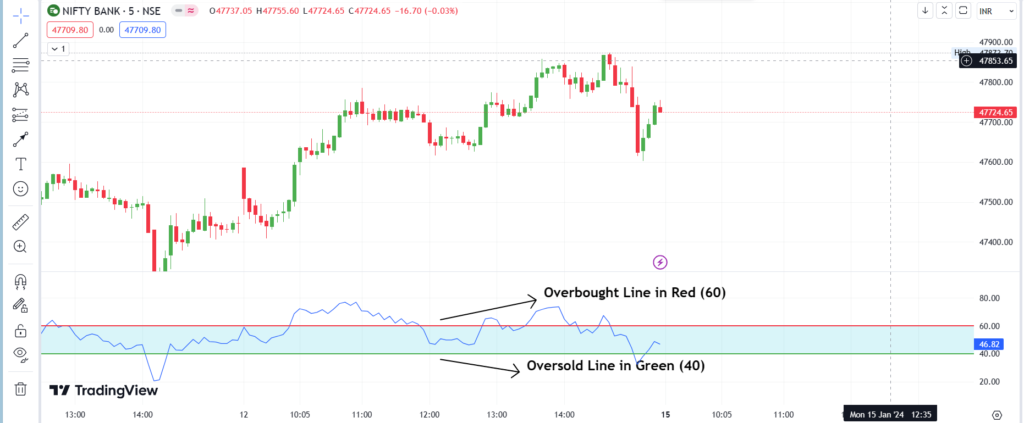
Relative Strength Index (RSI)
The RSI measures how rapidly and significantly a price moves. Levels above 70 indicate overbought conditions, signaling a potential reversal, while levels below 30 suggest oversold conditions. You can change the settings to 60 (Overbought) and 40 (Oversold) conditions.
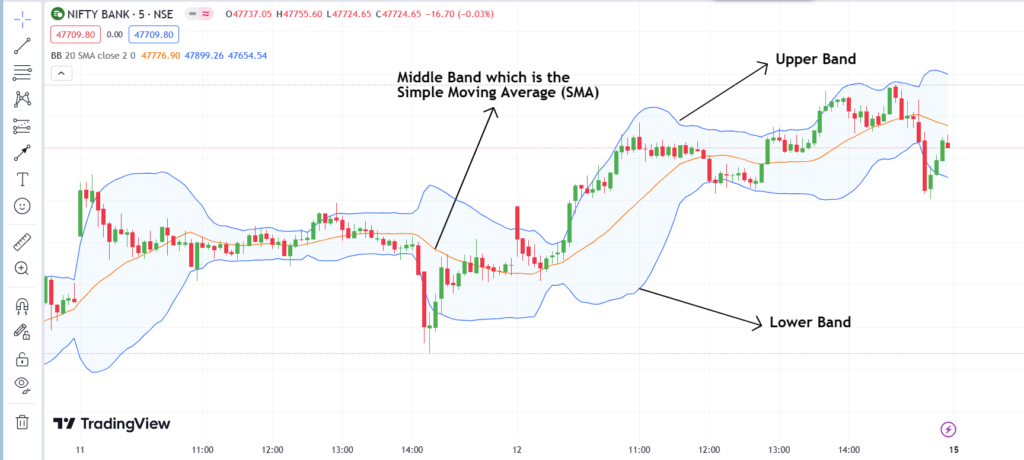
Bollinger Bands
A middle band (SMA) and two outer bands, which stand for standard deviations, form a Bollinger band. Traders use the bands to identify volatility and potential reversal points.
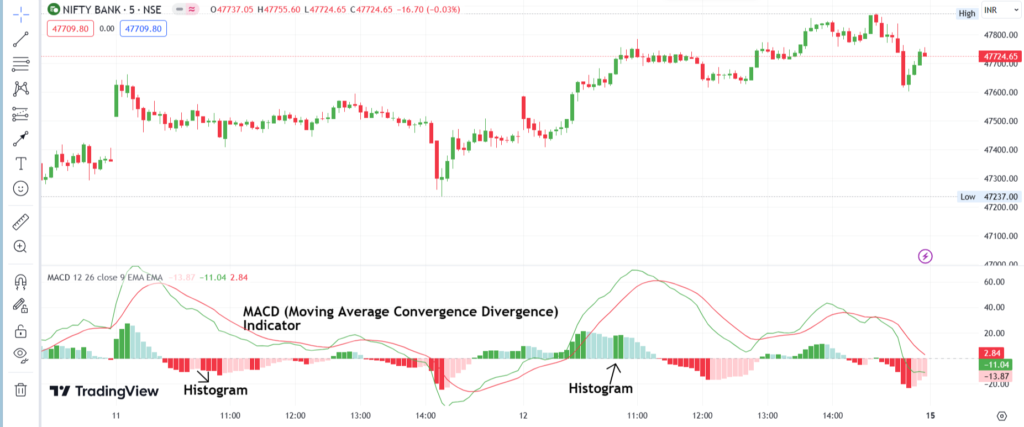
MACD (Moving Average Convergence Divergence)
MACD is a versatile indicator combining trend-following and momentum elements. The MACD histogram and signal lines help traders identify trend changes.
Stochastic Oscillator
Stochastic Oscillator gauges the closing price relative to the price range over a specified period. Overbought and oversold conditions are signals for potential reversals.
Fibonacci Retracement
Fibonacci Retracement involves using horizontal lines to indicate areas of support or resistance at the key Fibonacci levels before the price continues in the original direction.
ADX (Average Directional Index)
ADX measures trend strength without indicating direction. Swing traders use ADX to determine the strength of a current trend, helping them make informed decisions. ADX data helps traders in determining which trends are the strongest and easiest to trade. In addition, the values are crucial for differentiating between conditions that are trending and those that are not. When the ADX reading is above 25, many traders will advise that the trend is strong enough to support trend-trading strategies. On the other hand, many will stay away from trend-trading strategies when ADX is below 25. Check the table below:
| ADX Value | Trend Strength |
| 0-25 | Absent or Weak Trend |
| 25-50 | Strong Trend |
| 50-75 | Very Strong Trend |
| 75-100 | Extremely Strong Trend |

Ichimoku Cloud
Ichimoku Cloud incorporates multiple lines and a cloud to offer comprehensive information on potential support, resistance, and trend direction.
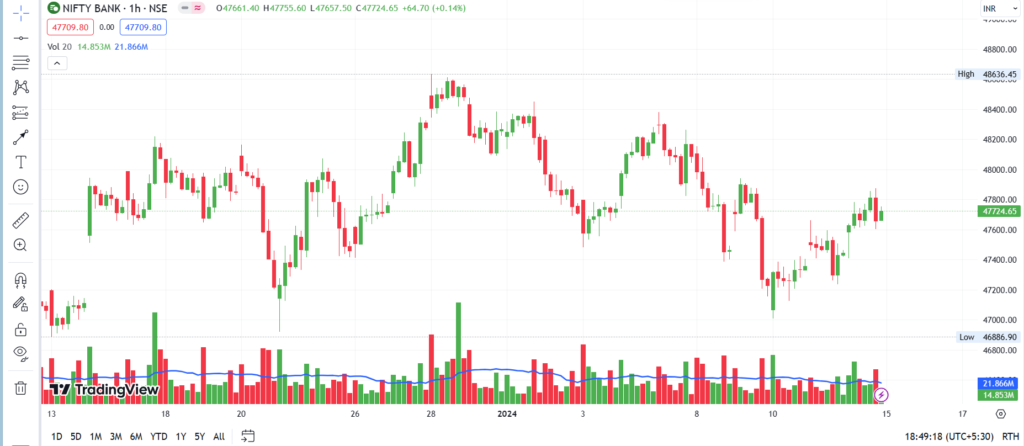
Volume Analysis
Volume is a crucial indicator in swing trading, confirming the strength of a price movement. High volume validates the significance of a trend.
Combining Multiple Indicators
While each indicator provides valuable insights, combining several enhances the overall robustness of a trading strategy. Traders should avoid relying on a single indicator for decision-making.
Case Studies: Successful Swing Trading with Technical Indicators
Real-life examples illustrate the practical application of technical indicators in swing trading.
Examining Real-life Examples
Case Study 1: XYZ Technology Corp
XYZ Technology Corp exhibited a bullish trend confirmed by rising SMAs, positive RSI, and expanding Bollinger Bands. Swing traders who recognized these signals entered positions, resulting in profitable trades.
Case Study 2: Biotech Innovations Ltd
Biotech Innovations Ltd, identified through MACD convergence and a supportive Ichimoku Cloud, experienced a trend reversal. Swing traders capitalized on this information, executing timely trades for substantial gains.
Lessons Learned from Analyzing Cases
These case studies underscore the importance of aligning multiple technical indicators to confirm trends. Successful swing traders use a combination of indicators to increase the probability of profitable trades.
Common Mistakes to Avoid in Using Technical Indicators
Overreliance on a Single Indicator
Relying solely on one indicator increases the risk of misinterpreting market conditions. A comprehensive approach, considering multiple indicators, provides a more accurate assessment.
Ignoring Market Conditions
Failing to consider broader market trends can lead to poor decision-making. Swing traders should assess overall market sentiment and adapt their strategies accordingly.
Failing to Adjust Strategies
Market conditions evolve, and successful swing traders adjust their strategies accordingly. Sticking rigidly to a predefined approach may result in missed opportunities or increased risks.
Conclusion
In the realm of swing trading, technical indicators serve as invaluable tools for navigating the complexities of the market. The best technical indicators for successful swing trading are those that align with the strategy’s timeframe, provide clear signals, and complement a trader’s overall analysis. By mastering the art of interpreting indicators and learning from real-life.
5 Unique FAQs
- Q: Can I solely rely on one technical indicator for swing trading?
- A: While indicators offer insights, relying on a single one increases the risk of misinterpretation. Successful swing traders often use a combination to enhance accuracy.
- Q: How do I know which technical indicators align with my swing trading strategy?
- A: Choose indicators based on their relevance to your desired timeframe and their ability to provide clear signals. Experimentation and analysis will help identify the most suitable ones for your approach.
- Q: Is it necessary to monitor technical indicators constantly during a swing trade?
- A: Regular monitoring is advisable, but constant tracking may lead to overtrading. Set periodic check-ins to assess the indicators in the context of your overall trading strategy.
- Q: What role does volume play in swing trading, and why is it crucial?
- A: Volume confirms the strength of a price movement. High volume validates trends, providing swing traders with confidence in the significance of a particular market move.
- Q: How often should I adjust my swing trading strategy based on changing market conditions?
- A: Regular assessments are key. Consider adjusting your strategy quarterly or when significant market shifts occur. Flexibility is vital in adapting to evolving trends for sustained success.


