Table of Contents
The RSI (Relative Strength Index) indicator is best utilized in swing trading to detect oversold and overbought circumstances. Generally, when the RSI exceeds 70, the market is deemed overbought. When the RSI drops below 30, it is often considered oversold. Traders typically purchase at oversold levels and sell at overbought levels.
Would you like to learn more about how to use RSI in swing trading? Continue reading, and we will provide additional guidance!
What Is Swing Trading?
Just as the name suggests, swing trading is a method of trading where traders attempt to make the most from the ‘swings’ in the financial markets. In this scenario, ‘Swings’ means the varying market price movements over periods of time. Swing Traders usually hold their positions for a few days, to a maximum of a few weeks.
Swing traders rely heavily on technical and, on occasion, fundamental analysis to discover trading opportunities. Traders typically employ technical indicators to help them find the best entry and exit opportunities.
The RSI, or Relative Strength Index, is a popular technical indicator for swing trading.
What is RSI?
The Relative Strength Index (RSI) is a specialized indicator that helps financial market traders determine when markets are oversold or overbought. It is commonly referred to as a momentum indicator and examines the market by assessing the amount of price fluctuations.
The indicator is typically displayed as an oscillator, which is a graph line that oscillates between the extremes of 0 and 100.
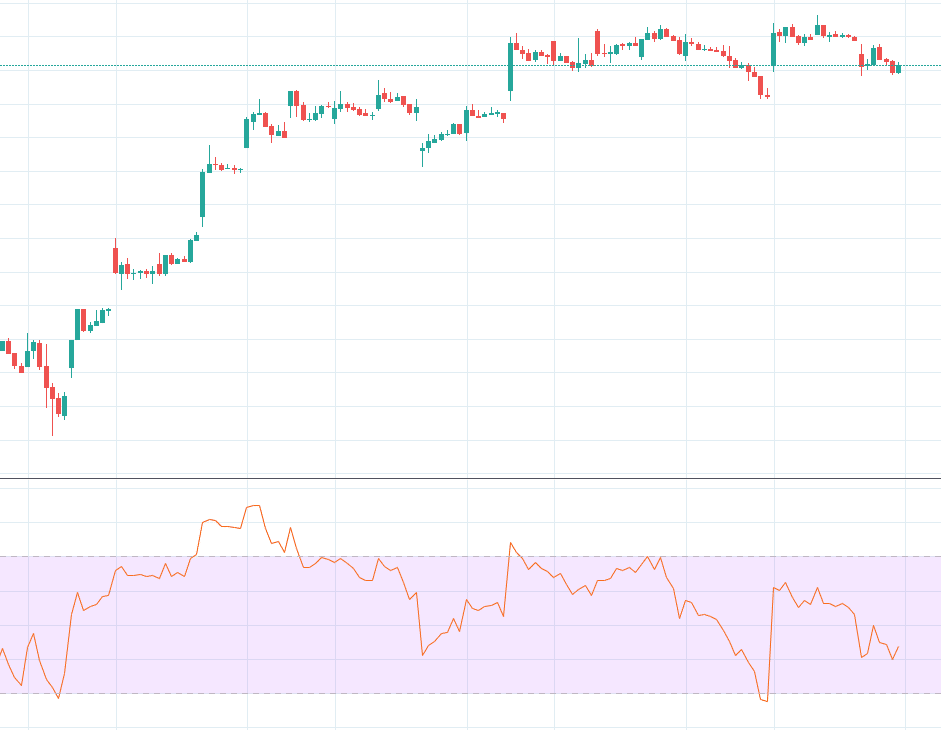
As shown in the chart above, the RSI indicator is typically presented below the trade chart as a line graph, in this example in red. The central section in the RSI window is highlighted in purple. The top level is the overbought threshold, while the lower is the oversold threshold. In other words, when the RSI lines cross the upper threshold, it indicates that the security has become overbought. Conversely, if the RSI line falls below the lower barrier, it indicates that the security is becoming oversold.
Also Read: Best Technical Indicators for Successful Swing Trading
")


