Table of Contents
Swing trading forex does not require you to use the smallest periods of time. Let’s take a look at swing trading, which has horizons that span many days.
What is Swing Trading?
Swing trading is a method that seeks to profit on oscillations inside larger market movements.
Swing traders will look for trading opportunities within a time frame that could range from a few days to many weeks. It differs from day trading, which aims to generate a profit within a day. It is also not a long-term investment, unlike position trading, which may be left alone for months or even years.
Swing trading aims to profit from a small portion of a larger trend inside a specific market. Even during major bull or bear moves, most assets experience significant price movement against the prevailing trend. Swing traders aim to profit on price movements.
Assume that GBP/USD experiences a bull run from 1.3245 to 1.3478 across several quarters. On a chart, this motion would virtually never appear as a straight line. Indeed, there may be days or even weeks of negative activity while buyers and sellers compete for control.
Swing traders look for opportunities to profit from modest market movements. They will attempt to purchase or sell a market at the start of a mini-trend (or swing) and maintain their position until it finishes.
Swing Trading Forex
Swing trading forex can be quite profitable.
A swing trader is not concerned with a currency’s long-term value; rather, they seek to profit from momentum peaks and troughs. Swing trading benefits from forex markets’ strong liquidity, tight spreads, and 24-hour nature (during market hours).
Swing Trading Forex Example: NZD/USD
On the chart below, the broad picture suggests a downward trend in the value of the New Zealand dollar. However, the swing trade displayed actually catches an upwards trend.
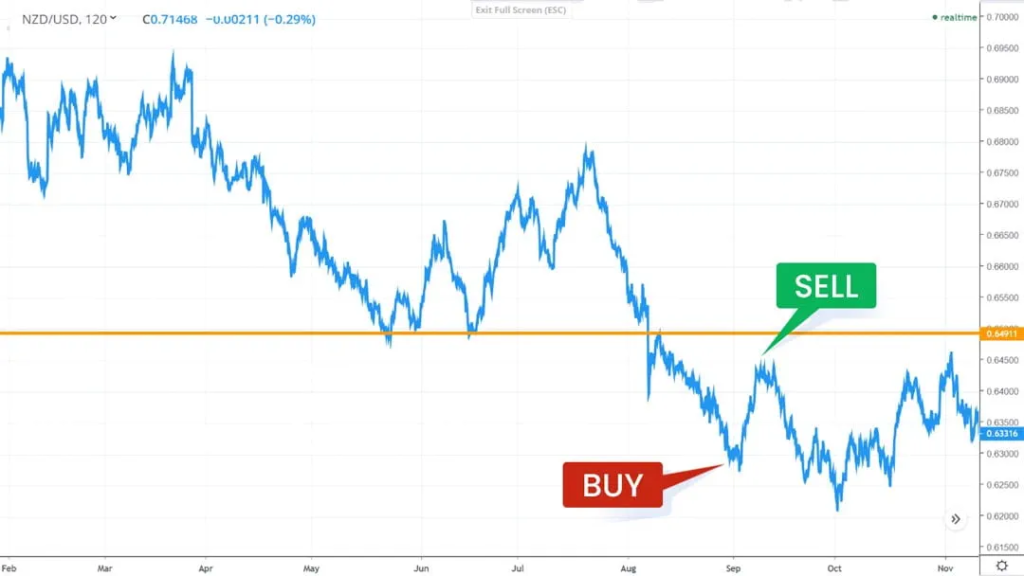
Look at the orange horizontal line. This shows what is regarded as a degree of key support. Between late May and the middle of June, we can see that it was tested on three consecutive occasions but held up.
However, following a period of recuperation, the New Zealand dollar dropped over the 0.649 mark and proceeded to tumble. At this moment, the potential of a swing trade emerged. By the time it reached 0.630, it was already trading roughly 9% lower than it was in March. In fact, NZD has not been worth as little as 63 cents in four years.
Looking For Consolidation
Take another close look at the graph. If you look closely, you can see that after weeks of freefall, the chart was consolidating around 0.630.
This is a frequent indicator traders will use to forecast a swing opportunity. Remember, we are not looking at the long-term value of a pair, but rather its potential to see a fast price movement in the short future.
So, the red arrow illustrates what, with the power of hindsight, would have been an excellent moment to buy NZD. When you hear talk about “buying the dip”, this is exactly the type of circumstance a trader is seeking.
Closing The Trade
Initially, the NZD fell even lower, but then rallied strongly, reaching near 0.645 within a few days. A trader who closes their position somewhere around here after buying near the red arrow has successfully completed a swing trade.
Consider the value of discipline here. A trader who wanted to retain their position and wait for an even bigger profit may have met problems: the line immediately swung back down, taking into any possible profit. The 0.645 mark was not regained until November, in reality. It is critical to avoid emotional bias and maintain a clinical approach to all elements of trade execution.
Please be mindful that previous performance is not indicative of future outcomes.
How do Swing Traders find opportunities?
Swing trading, like scalping, relies on technical indicators to determine when to enter and exit positions. Identifying support and resistance regions is a frequent strategy for predicting market reversals.
In the Technical Analysis course, we’ll go deeper into RSI, a popular technical instrument for swing trading.
A EUR/USD chart is shown here, with the Relative Strength Index (RSI) just beneath it.
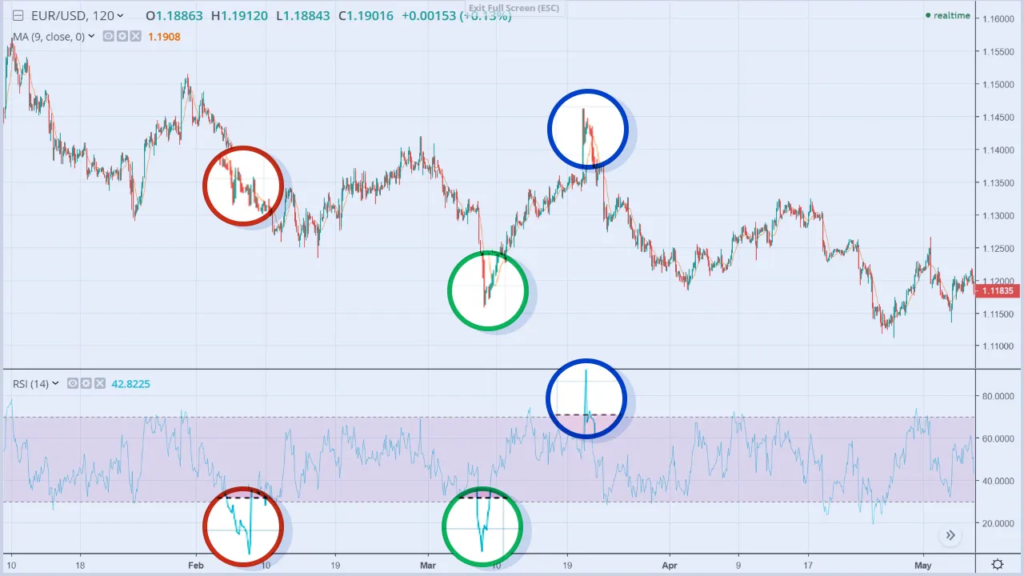
The RSI is a momentum oscillator that measures the rate and change of price movements. The RSI gauge fluctuates between 0 and 100. Historically, RSI is considered overbought when it exceeds 70 and oversold when it falls below 30.
On the chart above, the purple band symbolizes the 30-70 range, which occurs when a chart is neither overbought nor oversold. However, when it falls below 30 or rises above 70, the needle leaks into the white, indicating an opportunity for a swing trader.
Buying when a Market is Oversold
Let’s take a look at the two green circles now. The bottom circle denotes an RSI breakdown below 30 and suggests that the market is oversold. It implies a buy trade at this point, and the RSI prediction is correct as the market recovers significantly at this stage.
Selling when a Market is Overbought
But there will eventually be another adjustment. The blue circle on our chart above indicates that the market has entered overbought territory. You might benefit handsomely by entering into a short trade at this point.
However, RSI is not a foolproof technique for consistently profitable trading. The lower red circle depicts a large dip into the white. This time, the graph above does not show a resurgence in a negative trend.
It is critical in trading to understand that even the best traders in the world will not be correct every time; the secret to trading financially is to be correct the majority of the time. And to properly manage your risk when you’ve made the wrong decision.
Swing Trading Takeaways
- Swing trading is a medium-term strategy to the markets, ranging from day trading to position trading.
- Swing traders seek to profit from tiny movements inside broader trends.
- Swing trading allows you to use a variety of technical tools, such as RSI.
Frequently Asked Questions (FAQs) on Swing Trading Forex
1. What is swing trading?
Swing trading is a medium-term trading strategy that aims to profit from the oscillations or “swings” within larger market moves. Swing traders typically hold positions for a few days to several weeks, differing from day trading, which involves making trades within a single day, and position trading, which involves holding trades for months or years.
2. What is the typical timeframe for swing trading?
The timeframe for swing trading is medium-term, ranging from a few days to several weeks.
3. How do swing traders find trading opportunities?
Swing traders primarily use technical analysis to find trading opportunities. They look for key indicators such as areas of support and resistance, and technical tools like the Relative Strength Index (RSI) to determine entry and exit points.
4. Do swing traders need to understand technical indicators?
Yes, knowledge of technical indicators is crucial for swing traders as they rely heavily on technical analysis to identify potential trades.
5. What makes forex markets suitable for swing trading?
Forex markets are suitable for swing trading due to their high liquidity, tight spreads, and 24-hour trading availability. These factors make it easier to enter and exit trades and capture short-term market movements.
6. Can you give an example of a swing trade forex?
Sure. For instance, in the NZD/USD pair, a swing trader might observe the NZD consolidating at the 0.630 level after a period of decline. If the trader buys at this level and then sells when the NZD rebounds to 0.645, they have successfully executed a swing trade by capitalizing on the short-term upward movement.
7. What is the role of discipline in swing trading?
Discipline is crucial in swing trading. Traders must avoid being guided by emotions and stick to their planned strategy. For example, knowing when to close a position is vital to avoid losses from market reversals.
8. How do support and resistance levels help in swing trading?
Support and resistance levels are critical in swing trading as they often indicate where price reversals may occur. Traders use these levels to predict potential entry and exit points for trades.
9. What is the Relative Strength Index (RSI) and how is it used in swing trading?
RSI is a momentum oscillator that measures the speed and change of price movements, oscillating between zero and 100. In swing trading, RSI is used to identify overbought or oversold conditions. A reading above 70 suggests an overbought market (potential sell opportunity), while a reading below 30 suggests an oversold market (potential buy opportunity).
10. Are swing trading strategies always successful?
No, swing trading strategies are not always successful. Like any trading strategy, swing trading carries risks, and even the best traders do not win every trade. The key is to be right more often than wrong and to manage risk effectively.
11. What are the main takeaways from swing trading forex?
- Swing trading is a medium-term trading strategy.
- It involves looking to profit from smaller moves within larger trends.
- Technical analysis tools, such as RSI, are commonly used in swing trading.
- Discipline and risk management are crucial for success.
")


